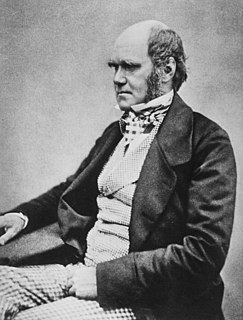
Top 2 Quotes & Sayings by William Sealy Gosset
Explore popular quotes and sayings by an English scientist William Sealy Gosset.
Last updated on April 14, 2025.
Conclusions
I. A curve has been found representing the frequency distribution of standard deviations of samples drawn from a normal population.
II. A curve has been found representing the frequency distribution of values of the means of such samples, when these values are measured from the mean of the population in terms of the standard deviation of the sample...
III. Tables are given by which it can be judged whether a series of experiments, however short, have given a result which conforms to any required standard of accuracy or whether it is necessary to continue the investigation.
I fancy you give me credit for being a more systematic sort of cove than I really am in the matter of limits of significance. What would actually happen would be that I should make out Pt (normal) and say to myself that would be about 50:1; pretty good but as it may not be normal we'd best not be too certain, or 100:1; even allowing that it may not be normal it seems good enough and whether one would be content with that or would require further work would depend on the importance of the conclusion and the difficulty of obtaining suitable experience.


