A Quote by Janet Yellen
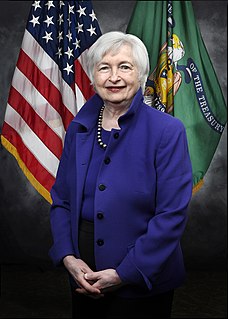
After adjusting for inflation, the average income of the top 5% of households grew by 38% from 1989 to 2013. By comparison, the average real income of the other 95% of households grew less than 10%.
Related Quotes
The distribution of wealth is even more unequal than that of income. ...The wealthiest 5% of American households held 54% of all wealth reported in the 1989 survey. Their share rose to 61% in 2010 and reached 63% in 2013. By contrast, the rest of those in the top half of the wealth distribution ?families that in 2013 had a net worth between $81,000 and $1.9 million ?held 43% of wealth in 1989 and only 36% in 2013.
The average net worth of the lower half of the distribution, representing 62 million households, was $11,000 in 2013. About one-fourth of these families reported zero wealth or negative net worth, and a significant fraction of those said they were "underwater" on their home mortgages, owing more than the value of the home. This $11,000 average is 50 percent lower than the average wealth of the lower half of families in 1989, adjusted for inflation.
To make a proper moral appraisal of the prevalence of severe poverty today, we should focus not on comparisons with times past, when the global average income was much lower, but on a comparison with what would be possible in our time, given the current global average income and level of technological and administrative development.
The bottom quarter of the human population has only three-quarters of one percent of global household income, about one thirty-second of the average income in the world, whereas the people in the top five percent have nine times the average income. So the ratio between the averages in the top five percent and the bottom quarter is somewhere around 300 to one - a huge inequality that also gives you a sense of how easily poverty could be avoided.
Given the relativity concept, poverty cannot be eliminated. Indeed, an economic upturn with a broad improvement in household income does not guarantee a decrease in the size of the poor population, especially when the income growth of households below the poverty line is less promising than the overall.
It makes no difference to a widow with her savings in a 5 percent passbook account whether she pays 100 percent income tax on her interest income during a period of zero inflation or pays no income tax during years of 5 percent inflation. Either way, she is 'taxed' in a manner that leaves her no real income whatsoever. Any money she spends comes right out of capital. She would find outrageous a 100 percent income tax but doesn't seem to notice that 5 percent inflation is the economic equivalent.
For the three decades after WWII, incomes grew at about 3 percent a year for people up and down the income ladder, but since then most income growth has occurred among the top quintile. And among that group, most of the income growth has occurred among the top 5 percent. The pattern repeats itself all the way up. Most of the growth among the top 5 percent has been among the top 1 percent, and most of the growth among that group has been among the top one-tenth of one percent.
